Index
- Introduction
- Textual Topography
- Examples and Evaluation
- Characteristics’ representative embedding design
- Evolution
Introduction
I was watching Amelia Wattenberger’s “Climbing the Ladder of Abstraction” 1, in which she talks about how the levels of abstraction serve different purposes. Once we can’t deal with the cognitive load of having all the information displayed in all abstraction levels at once, making it easy to navigate to its different layers can augment us to solve various tasks. She talks about how AI eases this movement.
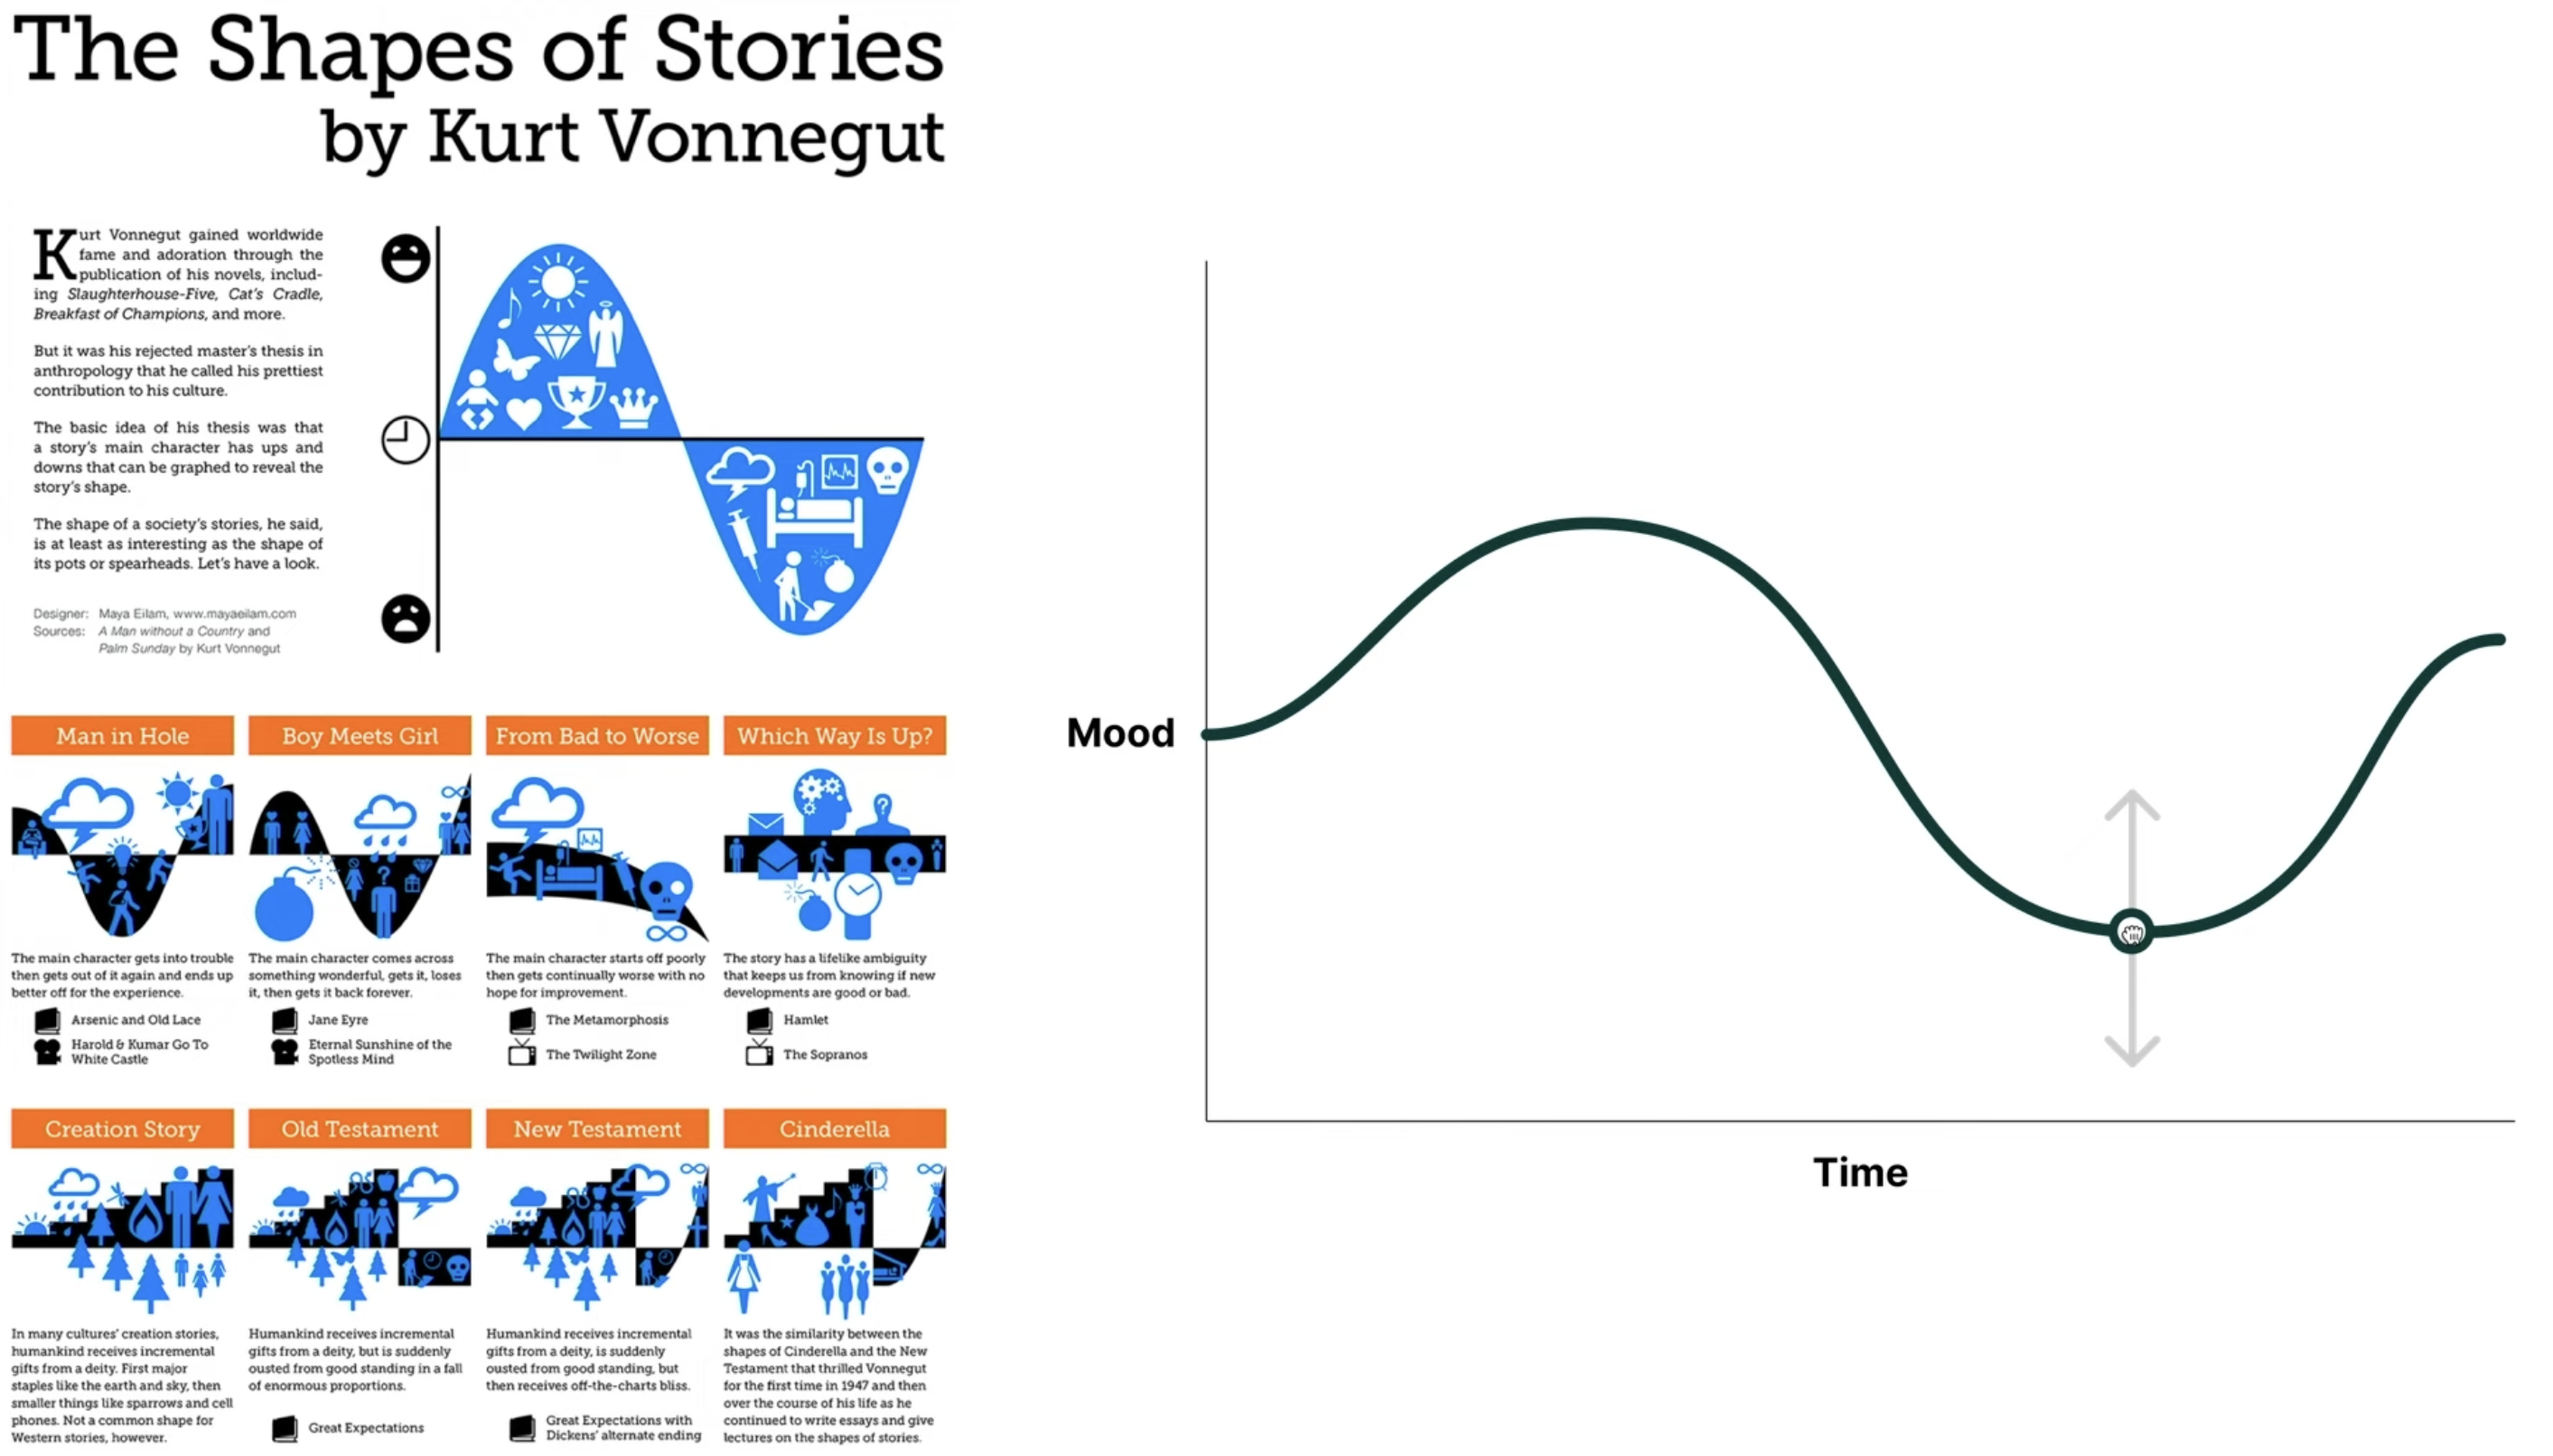
At some point, she shows Kurt Vonnegut’s “Shapes of Stories” and a plot representing it, using “mood” in the vertical axis and time in the horizontal axis to represent how a story’s mood varies. She even suggests one could interact with the plot to change the story’s shape.

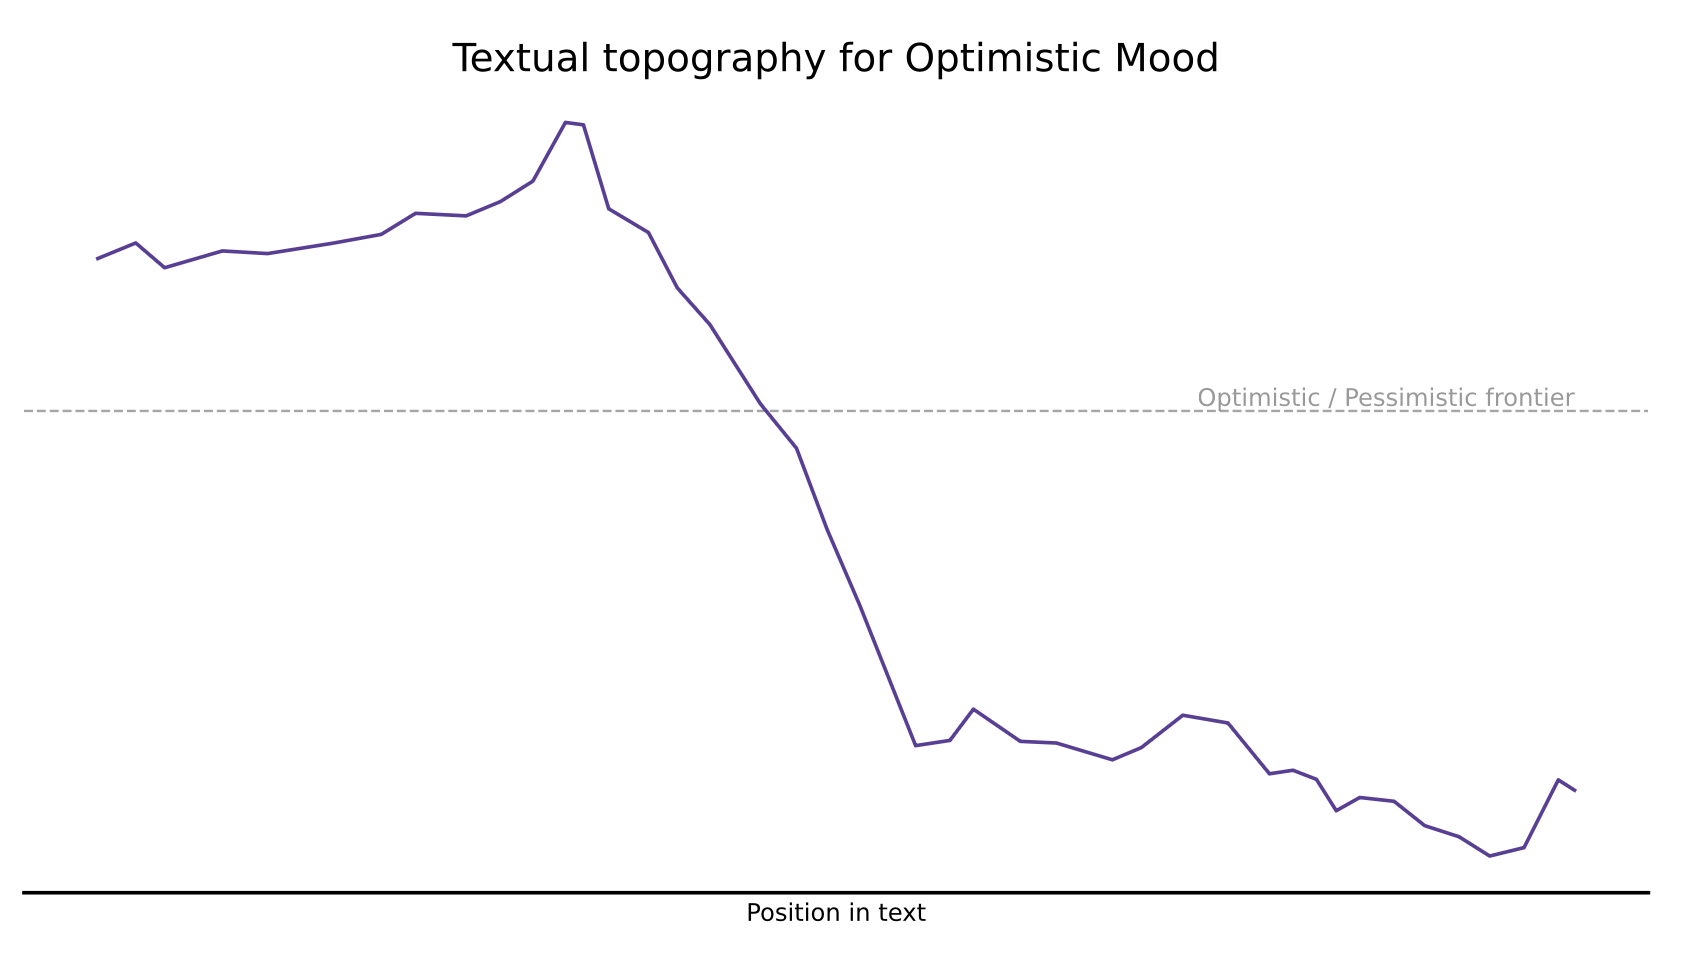
I’ve been inspired and decided to play with text’s shapes as “textual topography”. For example, here’s the topography for A relevance revolution for knowledge workers with respect to optimism.
The complete code is available, and I will comment on specific parts.
Textual Topography
I’m using the generic name of Textual Topography since I’m splitting it into domain, characteristic, and anti-characteristic, so it can adapt to different tasks. A domain is a relevant dimension for textual analysis: mood, style, and tone. A characteristic is a specific value inside these domains, and an anti-characteristic to contrast it, making the landscape more distinguishable. For example:
- Mood: happy x sad, excited x apathetic, calm x anxious;
- Tone: formal x casual, polite x blunt, respectful x disrespectful;
- Style: descriptive x concise, abstract x concrete, creative x technical;
To estimate the intensity of the characteristic, I’ve found inspiration in another Amelia Wattenberger’s work 2. I generate a reference embedding for the characteristic and for the anti-characteristic. I either use a fixed prompt or an excerpt from the input text to set the theme for the LLM and request it to write sentences “which the {domain} is extremely {characteristic}”, then I average the embeddings of these sentences and use them as the reference.

I break the input text into sentences that become embeddings, too. I compare the sentence embeddings to the reference embedding and normalize by the difference between the reference embedding from the characteristic and the one from the anti-characteristic. Finally, I use a moving average to smooth the topography.
Examples and Evaluation
To evaluate if the approach makes sense and the topography represents reasonably the content, I generated four synthetic examples. The two stories are intended to have a particular shape for the happy mood. One is a half happy and half unhappy story excerpt. The other has a happy-unhappy-happy-unhappy pattern. The other two are an essay on AI and the introduction of a scientific article about evolution, both intended to test optimistic mood.
The plots generally follow the expected shape of these synthetic extreme examples. Since manual inspection of real cases sounds plausible, I will give it a try as-is and see how useful it is.
Characteristics’ representative embedding design
Contextualizing using the input text
In the very first version, I used a very short prompt to create the reference sentences: “Generate an example of sentence extracted from a literary classic novel in which the {domain} is {characteristic}.”. It worked perfectly for the synthetic examples I created since I started with the ones based on stories.
def generate_instances_of_domain_and_characteristic(domain, characteristic, n=10, verbose=False, prompt=None):
    # Initialize the OpenAI model with a higher temperature for variety
    llm = OpenAI(temperature=0.8, max_tokens=200)

    # Define the prompt
    if not prompt:
        prompt = f"Generate an example of sentence extracted from a literary classic novel in which the {domain} is {characteristic}."

    # Generate multiple examples by calling the model multiple times
    examples = [llm(prompt) for _ in range(n)]

    if verbose:
        # Print the generated examples
        for i, example in enumerate(examples, 1):
            print(f"Example {i}:\n{example}\n")

    return examples
When I decided to analyze my blog posts, I was expecting them to perform poorly. The result made sense after manual inspection of the sentences in the curve, but I wondered if I had to adjust for the theme. I created the example regarding AI and Evolution, and I remixed the prompt to be dependent on the input text.
def build_prompt_to_follow_input_theme(domain, characteristic, input_sentences, n_samples=10):
    n_samples = min(len(input_sentences), n_samples)
    senteces_sample = random.sample(input_sentences, n_samples)

    senteces_prompt_example = "\n\n".join(senteces_sample)

    return f"Generate an example of sentence that the {domain} is extremely {characteristic} and it fits the theme from the following sentences: \n {senteces_prompt_example}"
It wasn’t clear that it was helping. I had to iterate on this short prompt to make it work well in the synthetic examples. Here, I plot both approaches for the synthetic story and the science case. I identify them in the chart as “standard”, while the one using the input text is “contextual”.
Temperature
As a first step in investigating the two approaches and to determine how temperature should be set in each, I did an experiment changing the temperature of the LLM, generating the reference sentences for the characteristic embedding. I did it for the story and science examples.


The contextual shows a significant variance of results as the temperature changes. At the same time, the simpler version that uses “classic literature” and does not adapt to the input text is pretty stable and provides mostly vertical shifts that wouldn’t change our interpretation of a text’s topography.
Evolution
I want to explore multiple domains and characteristics in the same chart to observe their interaction and identify interesting or confusing passages more easily. For example, I want to see if I can shift text clarity in the regions where the text is very technical.
Comparing two different texts in the same chart for the same domain and characteristic also looks interesting. I can imagine using it to study the style of two authors and compare how my modifications when writing are changing the shape of my articles. I imagine looking at the topography of my work after the first draft and observing how it evolves after every revision.
The plot can also show key moments in the text, or clear segments, like sections and chapters.
For the feature itself, if proven valid, I’d like to have a couple of synthetic and real examples to run regression tests when modifying it. It wasn’t easy to iterate in the prompt and check which curve better represents a text’s topography. I want to play by setting general expectations about the shape or relative position of the curve for two text inputs and see if LLMs with vision capabilities can help tell if the challenger approach is better than the champion or if any modification I did broke the functionality.
I still need to explore more on how adding information about the input text can help craft the reference embedding, but the current results show I could use generic sentences that have a particular characteristic and cache the embeddings once I like the results. I’m likely to use the same set of cases, so having a library of embeddings that represent them well makes sense.
References
-
Wattenberger, A.; Climbing the Ladder of Abstraction, AI Engineer Summit 2023. ↩
-
Wattenberger, A.; Getting creative with embeddings. ↩


